Links

F. Husson website


Book Exploratory Multivariate Analysis Using R

Outline

Introduction

Principal Component Analysis

Correspondence Analysis

Multiple Correspondence Analysis

Clustering

Multiple Factor Analysis

To conclude

Forum

Interpreting plots

In a sensory analysis, a jury assessed six apple sauces based on a list of 11 descriptors such as acidity, bitterness, raw apple flavor, and so on. The scores were gathered in a table with applesauces as rows, and descriptors as columns, with entries the scores for the given product and descriptor. The descriptors are of three kinds: flavor (F), texture (T), and odor (O). For example, F.sweet corresponds to sweetness. In addition, an appreciation score (hedonistic) was given to each applesauce. A PCA was carried out on the data table, with the appreciation score added as a supplementary variable. The plots of individuals and variables are provided below.

Individuals' plot Variables' plot

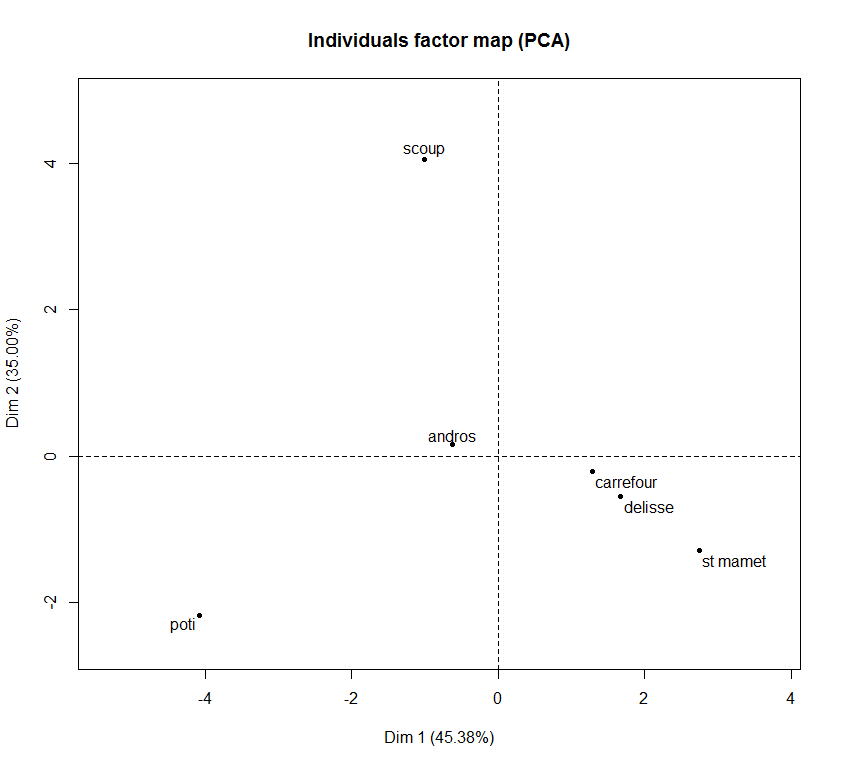
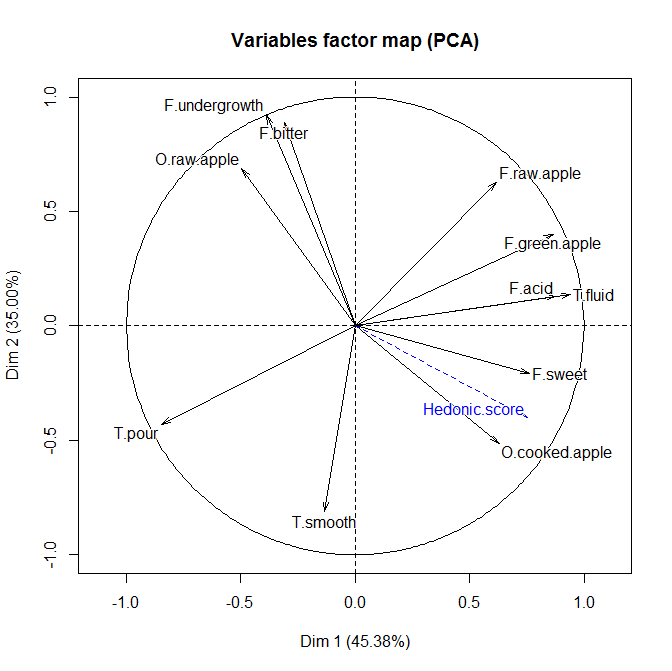
For each question, select the correct answer or answers.

Q1) Characterizing the individuals
The Poti and St Mamet applesauces are similar with respect to the set of variables
The poti applesauce is bitter
The Andros applesauce has average values for most variables

Q2) Contributions
The scoup applesauce is the one that most contributes to construction of the 2nd axis
The hedonistic (supplementary variable) appreciation score has strongly contributed to the construction of the axes
The Andros applesauce contributes very few to the construction of the plane 1-2

Q3) Interpreting the plots
The applesauces with strong raw apple odor have strong cooked apple odor
The St Mamet applesauce has a raw apple odor
The bitter applesauces have strong undergrowth flavor
The most preferred applesauces have a cooked apple odor

We use the same data as the previous exercise, and below is the output from FactoMineR.

Listing compote

Q4) Percentage of inertia
The percentage of variance represented in the first two axes is around 80 %
The third axis represents around 11 % of the information contained in the data set

Q5) Contribution to axis construction
The applesauce that most contributes to construction of the 1st axis is poti
The applesauce that most contributes to construction of the 2nd axis is poti
The poti and scoup applesauces together contribute more than 91 % to the construction of the 2nd axis

Q6) Results for the variables
The hedonistic score is associated with the 3rd axis
The T.fluid variable is well projected onto the 1st axis
The F.acid variable is well-projected onto the 1-2 plane

Q7) The poti and scoup applesauces are close to each other in the 1-2 plane
The poti and scoup applesauces are close to each other in the 1-2 plane
The andros applesauce is poorly projected onto the 1-2 plane
The poti applesauce is poorly projected onto the 1-2 plane

Score =
Correct answers: